Lab 19. A Simple OAP Node-RED Flow
- Thomas Watteyne
Owned by Thomas Watteyne
Expected completion time of this lab: 30 min.
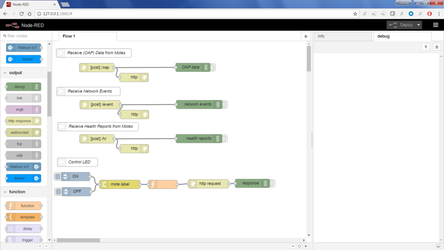
Import the Node-RED flow
JSON version of the flow
[{"id":"b244b277.a113a","type":"comment","z":"c139f50c.3569c8","name":"Receive (OAP) Data from Motes","info":"","x":154.1999969482422,"y":32.19999694824219,"wires":[]},{"id":"161c9e53.c6ed72","type":"http in","z":"c139f50c.3569c8","name":"","url":"/oap","method":"post","swaggerDoc":"","x":164.20001220703125,"y":82.60000610351562,"wires":[["272dd38f.e53c7c","887aad2b.eb4ee"]]},{"id":"272dd38f.e53c7c","type":"http response","z":"c139f50c.3569c8","name":"","x":293.2000274658203,"y":116.60000610351562,"wires":[]},{"id":"887aad2b.eb4ee","type":"debug","z":"c139f50c.3569c8","name":"OAP data","active":false,"console":"false","complete":"payload","x":497.1999816894531,"y":81.80000305175781,"wires":[]},{"id":"d9fbc935.f43658","type":"comment","z":"c139f50c.3569c8","name":"Receive Network Events","info":"","x":135.6999969482422,"y":165,"wires":[]},{"id":"d0015f05.aa6cd","type":"http in","z":"c139f50c.3569c8","name":"","url":"/event","method":"post","swaggerDoc":"","x":175.89999389648438,"y":211,"wires":[["19bcdf2.30d2221","ca8978d1.e66028"]]},{"id":"19bcdf2.30d2221","type":"http response","z":"c139f50c.3569c8","name":"","x":294.90000915527344,"y":245,"wires":[]},{"id":"ca8978d1.e66028","type":"debug","z":"c139f50c.3569c8","name":"network events","active":false,"console":"false","complete":"payload","x":518.8999633789062,"y":210.1999969482422,"wires":[]},{"id":"ba24702a.d4c76","type":"comment","z":"c139f50c.3569c8","name":"Receive Health Reports from Motes","info":"","x":168.89999389648438,"y":287.0000305175781,"wires":[]},{"id":"42af2ead.69ee1","type":"http in","z":"c139f50c.3569c8","name":"","url":"/hr","method":"post","swaggerDoc":"","x":165.09999084472656,"y":329.00001525878906,"wires":[["ae5a05b3.069f18","86b900c.e71e9"]]},{"id":"ae5a05b3.069f18","type":"http response","z":"c139f50c.3569c8","name":"","x":294.1000061035156,"y":363.00001525878906,"wires":[]},{"id":"86b900c.e71e9","type":"debug","z":"c139f50c.3569c8","name":"health reports","active":false,"console":"false","complete":"payload","x":518.0999603271484,"y":328.20001220703125,"wires":[]},{"id":"8adbbf9f.0f80c","type":"comment","z":"c139f50c.3569c8","name":"Control LED","info":"","x":97.89999389648438,"y":410.0000305175781,"wires":[]},{"id":"a3a3d7cd.fcc178","type":"inject","z":"c139f50c.3569c8","name":"ON","topic":"","payload":"1","payloadType":"num","repeat":"","crontab":"","once":false,"x":91.19999694824219,"y":459.60003662109375,"wires":[["df0ad2d3.fdfb3"]]},{"id":"532cf9b3.d26a08","type":"inject","z":"c139f50c.3569c8","name":"OFF","topic":"","payload":"0","payloadType":"num","repeat":"","crontab":"","once":false,"x":93.89999389648438,"y":512.0000305175781,"wires":[["df0ad2d3.fdfb3"]]},{"id":"8aa83bbc.a71358","type":"http request","z":"c139f50c.3569c8","name":"","method":"use","ret":"obj","url":"","tls":"","x":551.2000122070312,"y":484.8001403808594,"wires":[["2e1f1938.3d1aa6"]]},{"id":"df0ad2d3.fdfb3","type":"change","z":"c139f50c.3569c8","name":"mote label","rules":[{"t":"set","p":"motelabel","pt":"msg","to":"58F578","tot":"str"}],"action":"","property":"","from":"","to":"","reg":false,"x":244.20004272460938,"y":486.60003662109375,"wires":[["6154859f.f9306c"]]},{"id":"6154859f.f9306c","type":"function","z":"c139f50c.3569c8","name":"","func":"msg.method = 'PUT';\nmsg.url = 'http://127.0.0.1:8080/api/v1/oap/00-17-0d-00-00-'\nmsg.url += msg.motelabel.slice(0,2).toLowerCase()+'-'\nmsg.url += msg.motelabel.slice(2,4).toLowerCase()+'-'\nmsg.url += msg.motelabel.slice(4,6).toLowerCase()\nmsg.url += '/digital_out/INDICATOR_0';\nmsg.payload = {\n 'value': msg.payload\n};\nreturn msg;","outputs":1,"noerr":0,"x":393.1999816894531,"y":486.8000793457031,"wires":[["8aa83bbc.a71358"]]},{"id":"2e1f1938.3d1aa6","type":"debug","z":"c139f50c.3569c8","name":"response","active":true,"console":"false","complete":"payload","x":702.9000244140625,"y":483.0000305175781,"wires":[]}]
To import the flow above in your Node-RED instance:
- copy the string above (triple-click to select, then copy with Ctrl+C)
- in your Node-RED editor, on the hamburger menu on the upper right, select "Import" > "Clipboard"
- paste the string (Ctrl+V) and click "Import"
- activate the flow by clicking on the "Deploy" button
So what will I need to do?
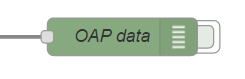
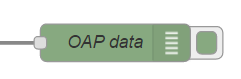
By default, all the "debug" notes of the flow are disabled:
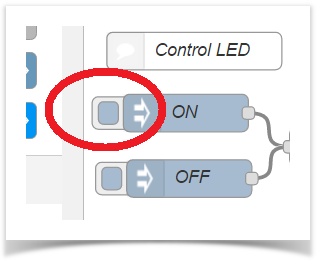
| debug node is disabled | debug node is enabled |
|---|---|
|
|
In this lab, you will be interacting with the following nodes:
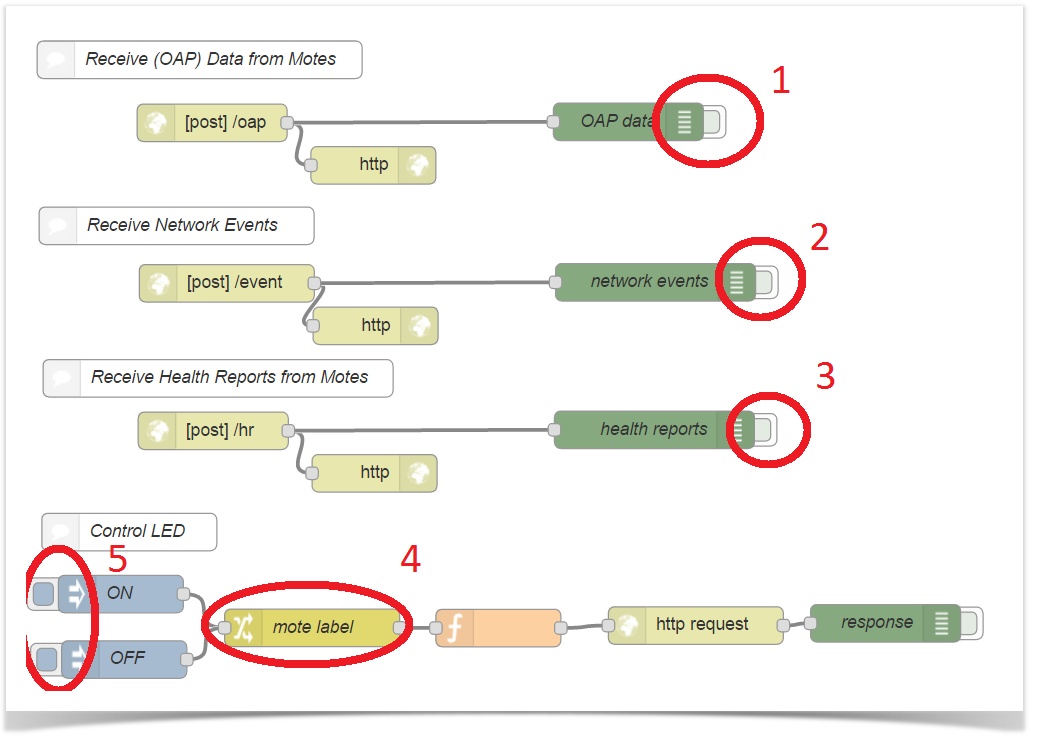
- you will enable/disable printing the received OAP data from motes
- you will enable/disable printing the received network events
- you will enable/disable printing the received health reports from motes
- you will be configuring the address of the mote you want to interact with
- you will be clicking to switch the mote's LED on and off
Receive (OAP) Data from Motes
- enable the "OAP data" debug node
- each OAP data notifications received by the manager from a mote appears in the debug panel
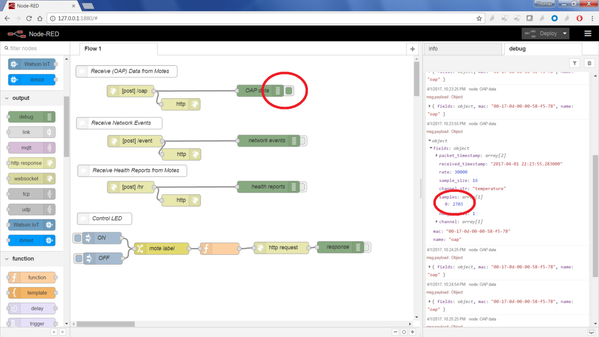
- unfold one of the events of with the "channel_str" of "temperature". The temperature reported by the node is the
fields/samples[0]sample, in 1/100th of a degree C. In the example above, 27.03 C - disable the "OAP data" debug node
Receive Network Events
- enable the "network events" debug node
- to generate network events, power cycle a node (switch it off, then on)
- a series of network events are reported by the manager, and displayed in the debug panel
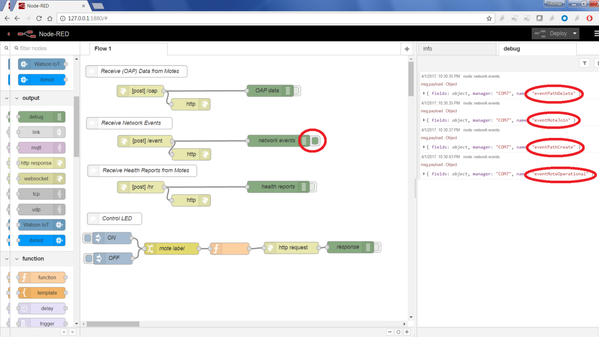
- when power cycling a node, the following event happens:
- "eventPathDelete": the mote re-joins, so the manager deletes all the paths (wireless communication opportunities) with its neighbors
- "eventMoteJoin": the mote initiated a joining procedure
- "eventPathCreate": the mote creates new paths to its neighbors
- "eventMoteOperational": the mote has fully joined the network
- disable the "network events" debug node
Receive Health Reports from Motes
- enable the "health reports" debug node
- whenever the manager received a health report from a mote, it appears in the debug panel
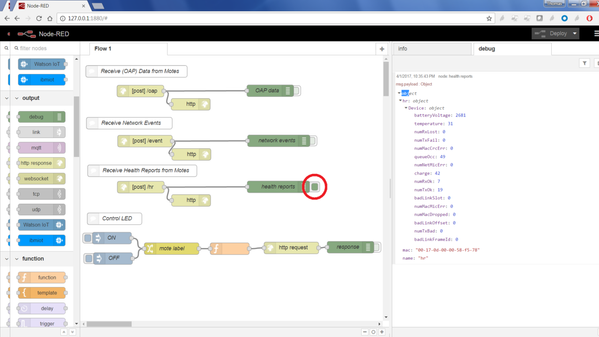
- disable the "health reports" debug node
Control LEDs
- enable the "network events" debug node
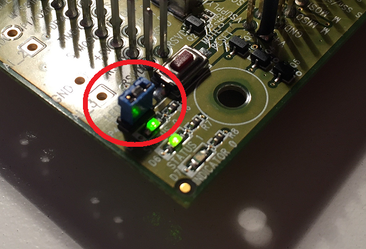
- choose a node in your network, ensure:
- its "LED EN" jumper is in place (so the LEDs are enabled)
- both green LED are on (meaning the mote has joined the network)
- read the unique identifier of the node from the QR-code sticker
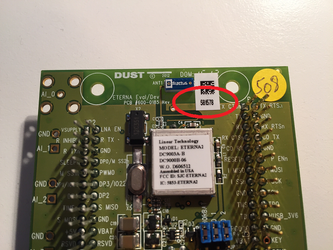
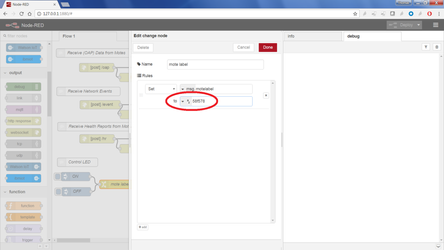
- double-click on the "mote label" node and enter the 6-digits exactly as printed on the sticker, then click "Done"
- Click "Deploy" to activate your changes
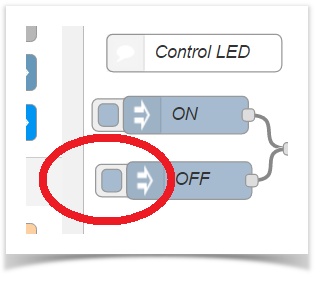
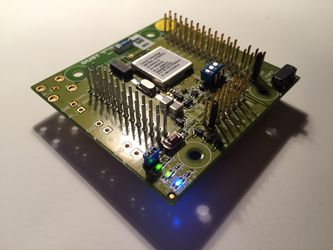
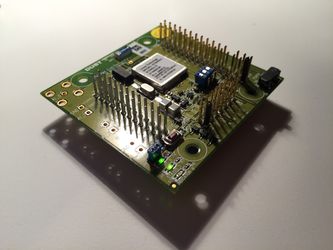
You can now click on the ON and OFF nodes to control the LED
switch the (blue) LED on switch the (blue) LED off