A Node-RED Dashboard-based OAP Client!
The Node-RED Dashboard is a quick and easy way to visually interact with your network. Here, you will use it as client software for the OAP protocol the motes implement.
SmartMesh IP motes running the default firmware in master mode terminate the On-Chip Application Protocol (OAP), documented in the SmartMesh IP Tools Guide.
OAP is a RESTful interface which allows your application to interact with the analog and digital interfaces of your SmartMesh IP motes.
This recipe shows you a Node-RED flow to interact with a mote in your network through a Node-RED Dashboard.
We assume you have already been through the Visualize your Data using Node-RED Dashboard recipe and that you can build a basic Node-RED dashboard to interact with your SmartMesh IP network.
Import the Node-RED flow
Because it's a rather complex Node-RED flow, we maintain it as a GitHub Gist at https://gist.github.com/twatteynelinear/f2b132b3a3275b4983a3bc2d97dc893a.
As any Node-RED flow, import the flow.json string into Node-RED:
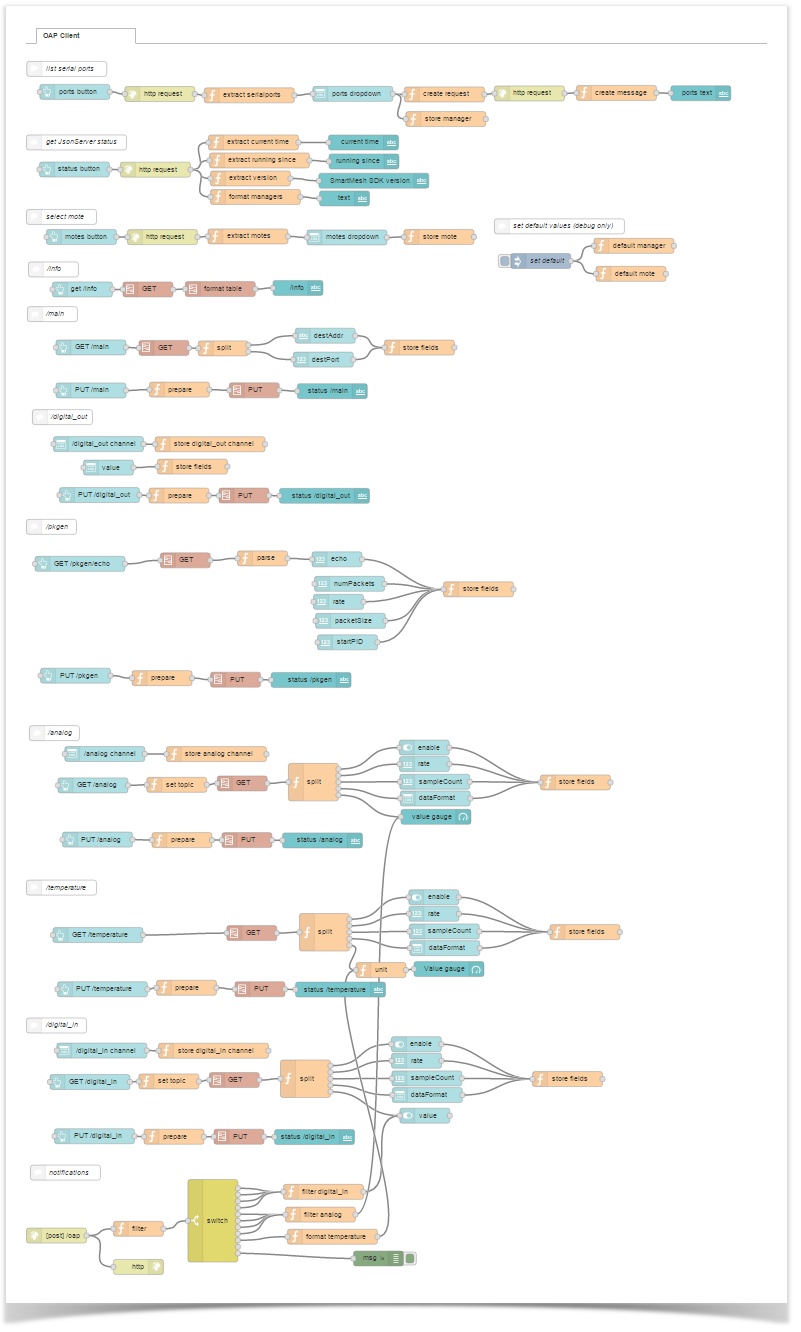
Walk-Through of the Application
We assume you just started JsonServer and Node-RED, and that you imported the flow.
You will find the dashboard at http://127.0.0.1:1880/ui (assume you are using Node-RED's default configuration).
Connect to the manager
In the "setup" tab of the Dashboard:
- Click on "list serial ports" and select the serial port which corresponds to the serial API of your manager. This will cause the
JsonServerto connect to that serial port.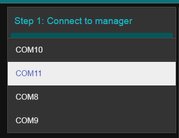
Click on "get status", the dashboard displays several statistics, and in particular confirms that the
JsonServeris connected to the manager.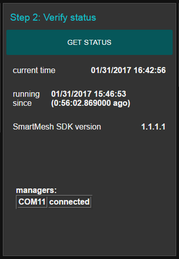
- Click on "list motes" and select the MAC address of the mote you want to interact with:
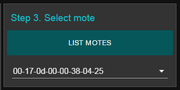
At any time, you can change the mote you are interacting with by selecting a different MAC address.
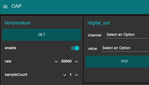
Interact over OAP
The "OAP" tab gives you a clear overview of the OAP resources, and allows you to get/set their state and visualize the notifications.
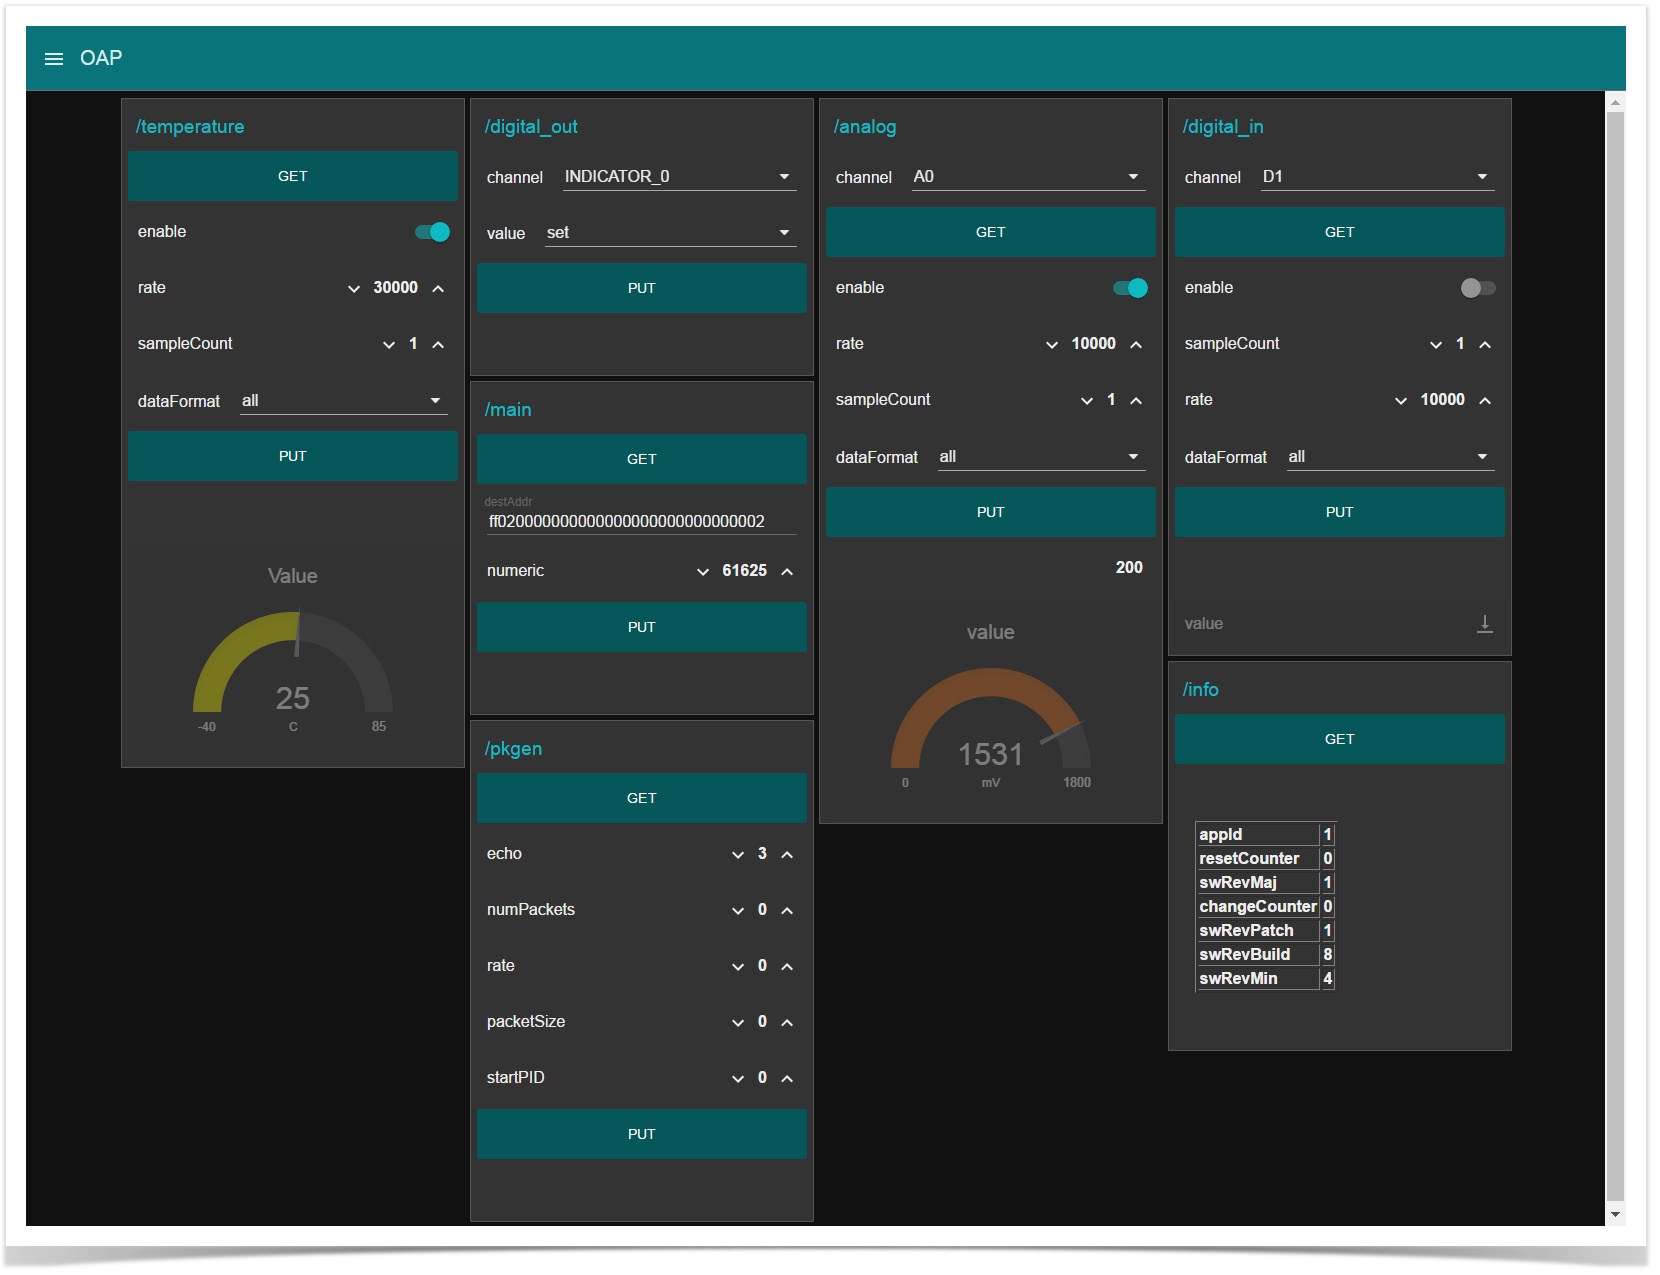
Some of the things to can do through this dashboard:
- read the configuration of all resources (temperature sensor, digital output pins, digital input pins, /main and /info resources, analog channels, packet generator)
- change all of these configurations
- monitor the voltage measured on an analog input
- verify the version of the software run by the mote
- change the IPv6 address to which the mote publishes OAP notifications
- etc.