Opening the Workspace
The On-Chip SDK contains an IAR workspace at onchipsdk/projects/iar/all_projects.eww. Double-click on this file to open the workspace.
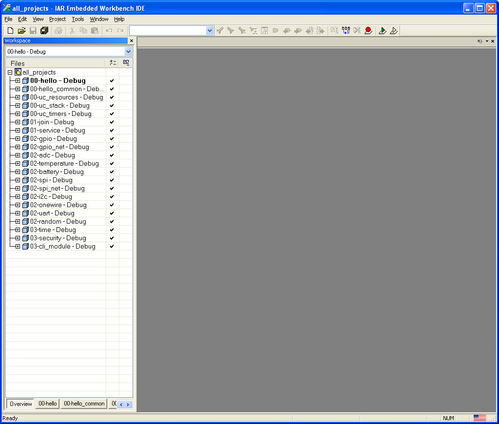
The column on the left lists a number of IAR projects, each corresponding to a sample application. You can switch between projects by right-clicking on the project name you want, and choosing Set as Active. We will select 00-hello if not already selected.
Building a Sample Application
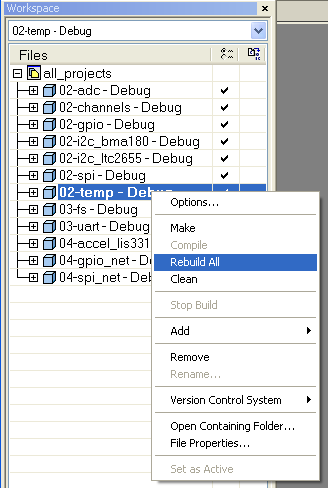
To build a project, right-click on the project name and choose Rebuild All. IAR now executes the following steps:
- Compile the C source code files listed in the projects file hierarchy into object files.
- Link those object files with the SmartMesh library, producing an ELF file.
- Convert that ELF file to a binary file.
Building configuration: 00-hello - Debug
Updating build tree...
8 file(s) deleted.
dnm_local.c
cli_task.c
dnm_rate_ctrl.c
dnm_service.c
hello_app.c
...
Linking
Performing Post-Build Action

Total number of errors: 0
Total number of warnings: 0
Running it on the Mote
No Debugger
If you don't have a JTAG debugging pod, you will use ESP to put your software on the mote. If you are not familiar with ESP, see the Eterna Serial Programmer Guide. ESP can be used on a DC9006/DC9003 directly, or with devices containing a recommended programming header with a DC9010 or a DC9006 with a DC9004 adapter.
- Copy the main executable ocfdk_00_hello.bin from the projects\iar\00-hello\Debug\exe directory into the ESP directory.
- Make sure the supporting files are also copied to the ESP directory.
- Program the part
ESP -E
ESP -P FT-DC9003A-M4-115K-680-0222-0004REV1.bin 0  (or other fuse table as appropriate)
ESP -P mote_part_r52074.bin 800
ESP -P ocfdk_00_hello.bin 1000
ESP -P loader_1_0_5_4_oski.bin 77800
- Connect to the mote CLI using a terminal program, reset the part. You should see the following on the CLI:
Hello World!
With a Debugger
If you have a JTAG debugging pod:
- Connect the debugging pod to the DC9006 and the DC9003 to the DC9006 If you have different hardware, connect the debugging pod to the the JTAG header on your board.
- If you haven't done so already, select the debugger under Project->Options->Debugger and configure it. See Setting Up a New Project for details.
- Select Download->Download Active application from the Project menu or press Alt-D.
- Connect to the mote CLI using a terminal program, reset the part, and see "Hello World!" print out. With an i-jet debugging pod, you may need to power cycle the part after programming.
- If the application fails to run, it may be that the part is programmed with an older loader. Try running the programming steps above, omitting the main executable before downloading via the debugging pod. This step is only needed once.
When loading your application onto the board, IAR may display the following dialog.
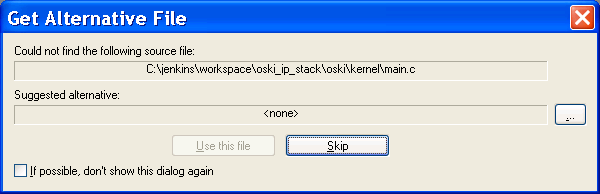
This indicates that IAR is not able to display the source file for a module inside the library. This is normal, and is not an error.
When this message appears, check If possible, don't show this dialog again and click Skip.
If you are using a DC9003 or similar device that was previously programmed as a mote, it came with loader 1.0.3.12. The part will run on the debugger, but appear to be dead after reset, since the older loader cannot execute the signed code (the loader is bypassed when running the debugger.) See the "No Debugger" steps above to reprogram with a 1.0.5.4 loader.