Building clouddata.dustcloud.org
Requirements
Goal
clouddata.dustcloud.org allows a customer to publish sensor data to the Internet less than 5 min after having opened a SmartMesh IP starter kit
This translates into the following requirements:
- clouddata.dustcloud.org must be able to receive sensor data, and store data as timelines for 12 hours.
- clouddata.dustcloud.org must offer a web interface to visualize the data.
Architecture
The solution consists of the PublishToWeb SmartMesh SDK program and the clouddata.dustcloud.org server.
PublishToWeb Smartmesh SDK application
This application is part of the default SmartMesh SDK, and runs on the user's computer. It:
- connects to the SmartMesh IP Manager
- subscribes to data notifications
- forwards all the OAP temperature data readings produced by the SmartMesh IP motes to clouddata.dustcloud.org.
clouddata.dusctloud.org server
The clouddata.dusctloud.org server is built on Ubuntu Server. It has the following internal architecture:
- the iptables firewall filters out all external traffic not going to TCP port 80
- the NGINX load balancer redirects:
- HTTP requests to http://clouddata.dustcloud.org/api/v1 to the
clouddata_serverscript running on TCP port 8080 - HTTP requests to http://clouddata.dustcloud.org/ to the grafana frontend running on TCP port 3000
- HTTP requests to http://clouddata.dustcloud.org/api/v1 to the
- the
clouddata_serverscript is part of the SmartMesh SDK. It receives data from the PublishToWeb.py application and inserts it into the database. - the influxdb database efficiently stores time series data. In this example, the database is configured to automatically drop data after 12 hours.
- the grafana data visualization tools offer a clean dashboard for visualizing the data
Installation Steps
Vagrant setup files for the step-by-step guide below are maintained at https://github.com/dustcloud/clouddata-server.
Ubuntu
At the time of writing, we have installed Ubuntu Server 16.04 LTS.
If you are installing the server on a virtual machine using VirtualBox for testing purposes:
- configure two network adapters:
- Adapter 1 as "NAT" (this allows your VM to access the web)
- Adaptor 2 as "Host-only Adapter" (this allows your host OS to access the web server running your VM)
after booting your VM, edit
/etc/network/interfacesto add the last lines corresponding to the second network interface# This file describes the network interfaces available on your system # and how to activate them. For more information, see interfaces(5). source /etc/network/interfaces.d/* # The loopback network interface auto lo iface lo inet loopback # The primary network interface (NAT) auto enp0s3 iface enp0s3 inet dhcp # The secondary network interface (Host-only adapter) auto enp0s8 iface enp0s8 inet dhcp
restart the networking services:
sudo service networking restart
Once installed, log into the server.
Update
sudo apt-get update
sudo apt-get upgrade
sudo apt-get dist-upgrade
The commands above update your entire OS. This can take 10-15min.
SSH
Install the OpenSSH server:
sudo apt-get install openssh-server
Add your public key to the server:
mkdir .ssh
touch .ssh/authorized_keys
echo "ssh-rsa AAAAB3NzaC1yc2EAAAABJQAAAIBx8jcskAQwgmw2ZR18K1cyW4NyQDFhLYiva4WLDHyVgxBuo95ndyeYHoc1lk6FpRpV9jdvTCD4rGx8OT28dFyVFvDSiNxbwm/qMHhvY9Vtu7842h0Hkelb5w2DU8Qvp33OQ67frQNKcvnYOP2MQxkfKVRInP/pfzuux0NiErcFxQ== rsa-key-thomas" > .ssh/authorized_keys
chmod 700 ~/.ssh
chmod 600 ~/.ssh/authorized_keys
chown $USER:$USER ~/.ssh -R
Edit /etc/ssh/sshd_config so it contains the following (un-commented) lines:
RSAAuthentication     yes
PubkeyAuthentication  yes
AuthorizedKeysFile    %h/.ssh/authorized_keys
Restart the SSH server:
sudo service ssh restart
influxdb
install database
Install and start InfluxDB automatically:
curl -sL https://repos.influxdata.com/influxdb.key | sudo apt-key add -
source /etc/lsb-release
echo "deb https://repos.influxdata.com/${DISTRIB_ID,,} ${DISTRIB_CODENAME} stable" | sudo tee /etc/apt/sources.list.d/influxdb.list
sudo apt-get update && sudo apt-get install influxdb
sudo systemctl start influxdb
sudo systemctl enable influxdb
You should see the InfluxDB admin panel at http://192.168.56.101:8083/.
By default, the HTTP API of InfluxDB runs on TCP port 8086.
create database
Use the influx client to create a database "grafana" and associate a retention policy so datapoints are automatically deleted after 12 hours:
user@ubuntu:~$ influx
Visit https://enterprise.influxdata.com to register for updates, InfluxDB server management, and monitoring.
Connected to http://localhost:8086 version 0.10.0
InfluxDB shell 0.10.0
> CREATE DATABASE grafana
> CREATE RETENTION POLICY twelve_h_only ON grafana DURATION 12h REPLICATION 1 DEFAULT
> exit
user@ubuntu:~$
Recent versions of the influxdb package include the command-line client. If your distribution has an older package, you may need to install the client separately.
sudo apt-get install influxdb-client
grafana
install
The following commands install grafana, start it, and ensure it also starts on the next boot:
wget https://grafanarel.s3.amazonaws.com/builds/grafana_3.0.4-1464167696_amd64.deb
sudo apt-get install -y adduser libfontconfig
sudo dpkg -i grafana_3.0.4-1464167696_amd64.deb
sudo systemctl daemon-reload
sudo systemctl start grafana-server
systemctl status grafana-server
sudo systemctl enable grafana-server.service
You should now be able to see the Grafana front end running at http://192.168.56.101:3000/.
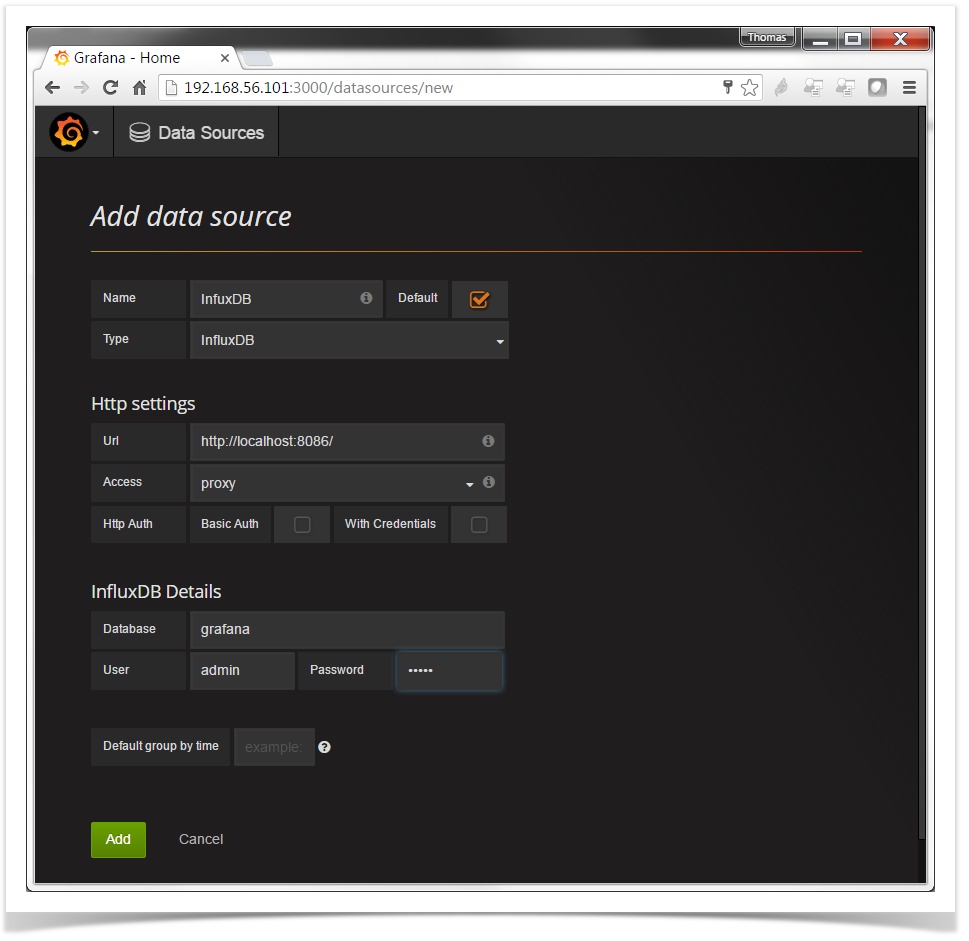
We are not using authentication between Grafana and InfluxDB, but you still have to provide a username/password in the "InfluxDB Details" section below.
change admin username and password
Connect to the Grafana front end with username "admin" and password "admin". Though the profile page, change both the username and password associated with the Grafana administrator.
connect to database
Through the admin interface, add InfluxDB as a data source. From the drop down menu in the upper left, choose Data Sources and click on Add data source.
create dashboard
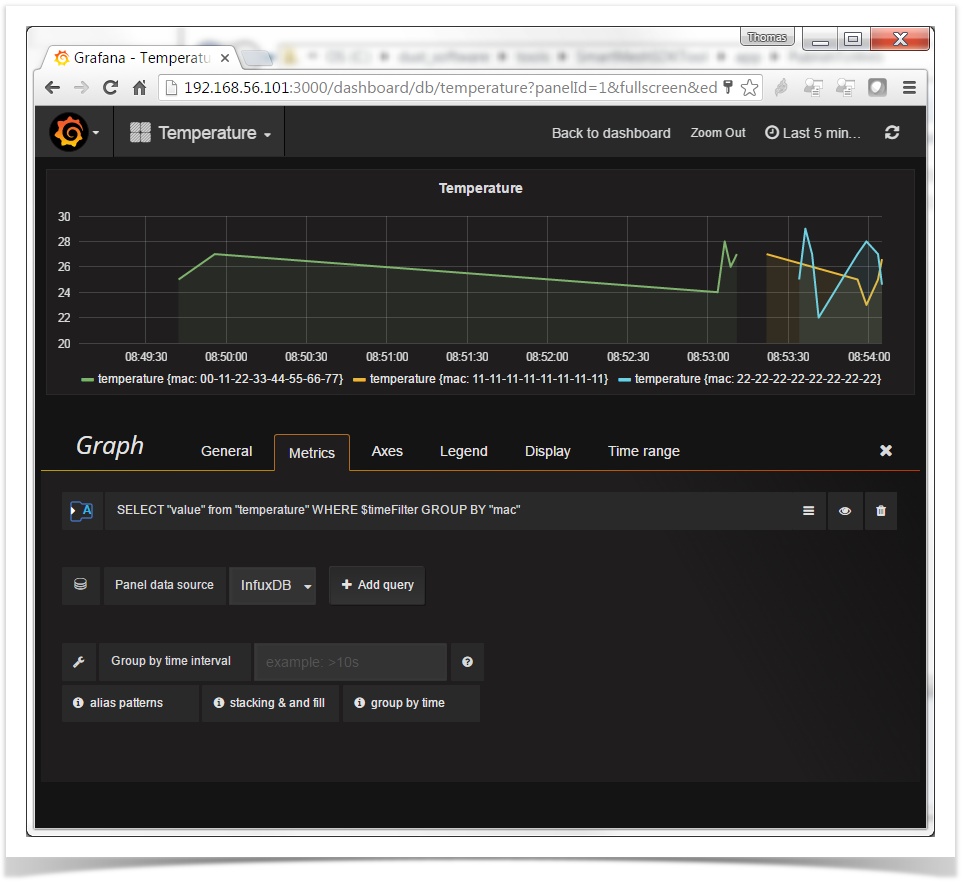
Through the admin interface, create a new dashboard named Temperature. From the drop down menu in the upper left, select Dashboards → New. The first row is already created, indicated by the vertical line on the left edge. Hovering over that indicator will reveal a menu for editing. Select Add Panel → Graph to create a graph of the temperature data. Under Metrics, select Toggle edit mode under the drop down menu (on the right next to the eye icon) to change the input mode so you can paste in the following query:
SELECT "value" from "temperature" WHERE $timeFilter GROUP BY "mac"
To verify everything works, on the Admin interface of InfluxDB (http://192.168.56.101:8083/), select the "grafana" database, click "Write Data" and enter:
temperature,mac=11-11-11-11-11-11-11-11 value=29
temperature,mac=22-22-22-22-22-22-22-22 value=21
enable anonymous access
Change the /etc/grafana/grafana.ini file so it contains the following lines:
#################################### Anonymous Auth ##########################
[auth.anonymous]
# enable anonymous access
enabled = true
set as default dashboard
- log into Grafana as admin
- star the dashboard you create
- in the dropdown menu, edit the setting for the default organization, and set the dashboard as default home dashboard
clouddata_server script
install Python
sudo apt-get install python-minimal
sudo apt-get install python-pip
install clouddata_server script
You can download the cloudata_server.py script as part of the SmartMesh SDK. You will find it in the app/PublishToWeb/ directory.
Install the Python dependencies of the SmartMesh SDK:
pip install -r requirements.txt
run at startup
Install supervisor:
sudo apt-get install supervisor
Create a new file for supervisor to manage the clouddata_server process:
sudo vim /etc/supervisor/conf.d/clouddata_server.conf
Include the following contents, where _USER_ is replaced with the current username:
[program:clouddata_server]
environment=PYTHONPATH=/home/_USER_/.local/lib/python2.7/site-packages/
directory=/home/_USER_/
command=/usr/bin/python clouddata_server.py
user=_USER_
autostart=true
autorestart=true
stdout_logfile=/home/_USER_/clouddata_server.log
stdout_logfile_maxbytes=10MB
stderr_logfile=/home/_USER_/clouddata_server.errlog
stderr_logfile_maxbytes=10MB
Start the supervisor daemon and configure the daemon to start when the system is booted:
sudo systemctl start supervisor
sudo systemctl enable supervisor
NGINX
installation
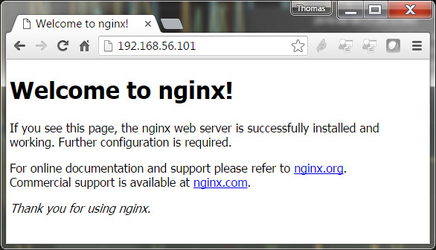
sudo apt-get install nginx
nginx starts automatically. Pointing your browser at http://192.168.56.101/ shows you the default interface:
configuration
We will use nginx in proxy mode. The role is that it redirects per the table below:
| url | point to |
|---|---|
http://<ip_address>/api/v1/oap | http://<ip_address>:8080/oap |
http://<ip_address>/ | http://<ip_address>:3000/ |
Create file /etc/nginx/sites-available/clouddata_server with the following contents:
server {
        listen 80 default_server;
        listen [::]:80 default_server;

        root /var/www/html;

        index index.html index.htm index.nginx-debian.html;

        server_name _;

        location /api/v1 {
                proxy_pass         http://localhost:8080;
                rewrite            ^/api/v1/(.*)  /$1 break;
                proxy_set_header   Host $host;
        }

        location / {
                proxy_pass         http://localhost:3000;
                rewrite            ^/(.*)  /$1 break;
                proxy_set_header   Host $host;
        }
}
Install the script:
sudo rm /etc/nginx/sites-enabled/default
sudo ln -s /etc/nginx/sites-available/clouddata_server /etc/nginx/sites-enabled/default
Restart the server:
sudo nginx -s reload
iptables
It is important you step through the iptables instructions in the order they are written!
configure
Type the following commands in this order to configure iptables (the firewall):
sudo iptables -I INPUT -i lo -j ACCEPT
sudo iptables -A INPUT -p tcp --dport ssh -j ACCEPT
sudo iptables -A INPUT -p tcp --dport 80 -j ACCEPT
sudo iptables -A OUTPUT -p udp -d 8.8.8.8 --dport 53 -m state --state NEW,ESTABLISHED -j ACCEPT
sudo iptables -A INPUT  -p udp -s 8.8.8.8 --sport 53 -m state --state ESTABLISHED     -j ACCEPT
sudo iptables -A OUTPUT -p tcp -d 8.8.8.8 --dport 53 -m state --state NEW,ESTABLISHED -j ACCEPT
sudo iptables -A INPUT  -p tcp -s 8.8.8.8 --sport 53 -m state --state ESTABLISHED     -j ACCEPT
sudo iptables -A OUTPUT -p tcp --dport 80 -m state --state NEW,ESTABLISHED -j ACCEPT
sudo iptables -A INPUT -p tcp --sport 80 -m state --state ESTABLISHED -j ACCEPT
sudo iptables -A INPUT -p icmp --icmp-type 8 -m state --state NEW,ESTABLISHED,RELATED -j ACCEPT
sudo iptables -A OUTPUT -p icmp --icmp-type 0 -m state --state ESTABLISHED,RELATED -j ACCEPT
sudo iptables -A OUTPUT -p icmp --icmp-type 8 -m state --state NEW,ESTABLISHED,RELATED -j ACCEPT
sudo iptables -A INPUT -p icmp --icmp-type 0 -m state --state ESTABLISHED,RELATED -j ACCEPT
sudo iptables -A INPUT -j DROP
There lines have the following actions (respectively):
- [line 1] all ports are open for communication internal to the server (needed for the communication between grafana, influxdb, and
clouddata_server) - [line 2] accept incoming SSH traffic (needed for you to configure the server later on)
- [line 3] accept incoming HTTP traffic (needed for a client to push sensor data and see the grafana web interface)
- [lines 4,5,6,7] allow outgoing DNS queries
- [lines 8,9] allow outgoing HTTP traffic (needed for example to use
apt-get) - [lines 10,11] allow incoming ping requests (needed so you can ping your server)
- [lines 12,13] allow outgoing ping requests (needed so from the server you can ping other hosts to verify connectivity)
- [line 14] drop all other incoming traffic
verify
Type the following command to verify all rules are active:
$ sudo iptables -L -v

Chain INPUT (policy ACCEPT 0 packets, 0 bytes)
 pkts bytes target     prot opt in     out     source               destination
 1074  108K ACCEPT     all  --  lo     any     anywhere             anywhere
  128  8280 ACCEPT     tcp  --  any    any     anywhere             anywhere             tcp dpt:ssh
  300 43541 ACCEPT     tcp  --  any    any     anywhere             anywhere             tcp dpt:http
    0     0 ACCEPT     udp  --  any    any     google-public-dns-a.google.com  anywhere             udp spt:domain state ESTABLISHED
    0     0 ACCEPT     tcp  --  any    any     google-public-dns-a.google.com  anywhere             tcp spt:domain state ESTABLISHED
    0     0 ACCEPT     tcp  --  any    any     anywhere             anywhere             tcp spt:http state ESTABLISHED
   34  2040 ACCEPT     icmp --  any    any     anywhere             anywhere             icmp echo-request state NEW,RELATED,ESTABLISHED
    1    84 ACCEPT     icmp --  any    any     anywhere             anywhere             icmp echo-reply state RELATED,ESTABLISHED
    7  4444 DROP       all  --  any    any     anywhere             anywhere

Chain FORWARD (policy ACCEPT 0 packets, 0 bytes)
 pkts bytes target     prot opt in     out     source               destination

Chain OUTPUT (policy ACCEPT 287 packets, 34696 bytes)
 pkts bytes target     prot opt in     out     source               destination
    0     0 ACCEPT     udp  --  any    any     anywhere             google-public-dns-a.google.com  udp dpt:domain state NEW,ESTABLISHED
    0     0 ACCEPT     tcp  --  any    any     anywhere             google-public-dns-a.google.com  tcp dpt:domain state NEW,ESTABLISHED
    0     0 ACCEPT     tcp  --  any    any     anywhere             anywhere             tcp dpt:http state NEW,ESTABLISHED
   30  1800 ACCEPT     icmp --  any    any     anywhere             anywhere             icmp echo-reply state RELATED,ESTABLISHED
    1    84 ACCEPT     icmp --  any    any     anywhere             anywhere             icmp echo-request state NEW,RELATED,ESTABLISHED
run at boot
By default, your iptables rules will disappear at reboot. The iptables-persistent packages allows them to be applied at each reboot.
Install the iptables-persistent package:
sudo apt-get install iptables-persistent
At installation, make sure to click "yes" to save the current IPv4 and IPv6 rules
Testing
Once you have the server running, you can test it by using the following scripts:
PublishRandom.pypublishes a random temperature coming from a (fake) random MAC addressPublishToWeb.py
Make sure to reboot reboot the server and verify everything starts up as expected. You should be able to ping the server, but not access the grafana website on port 3000, or the influxdb admin interface on port 8083.